Foursquare ITP is developing a second iteration of the annual Metrobus line performance report using a fully automated process in the R programming language. As a follow on to the Adopted 2020 Bus Service Guidelines Foursquare ITP developed for the WMATA Bus Transformation Project, the Annual Line Performance Report was developed to visualize the applications of the standards and guidelines across the system.
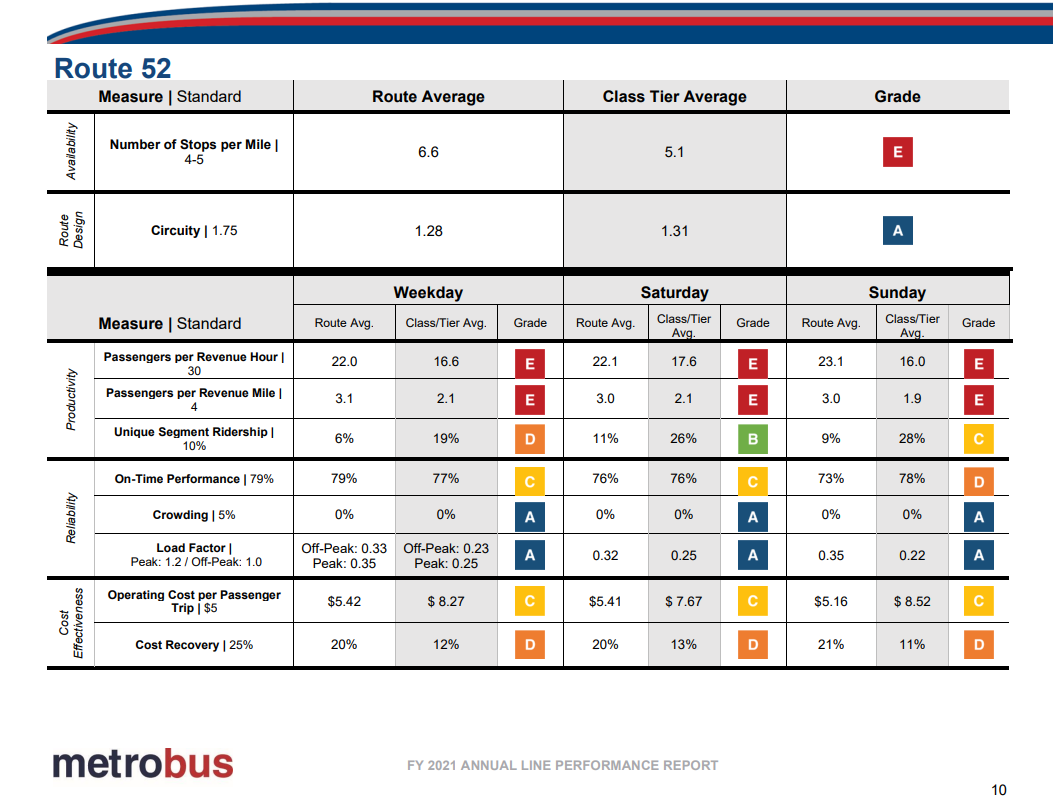
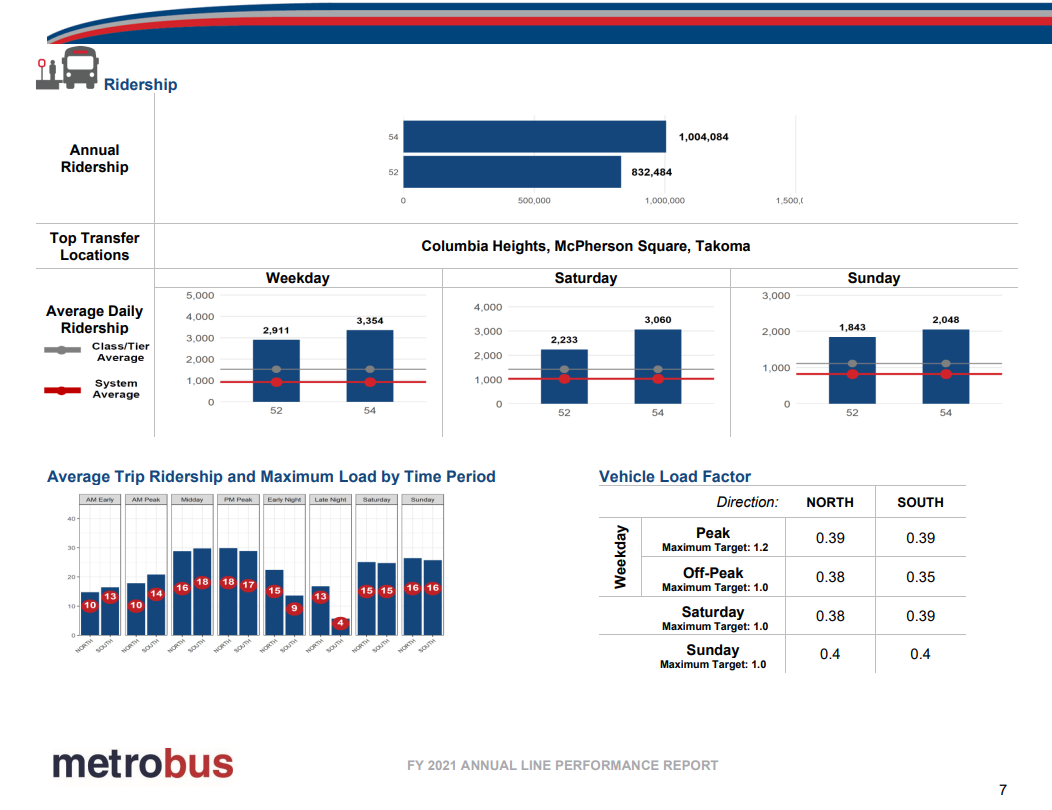
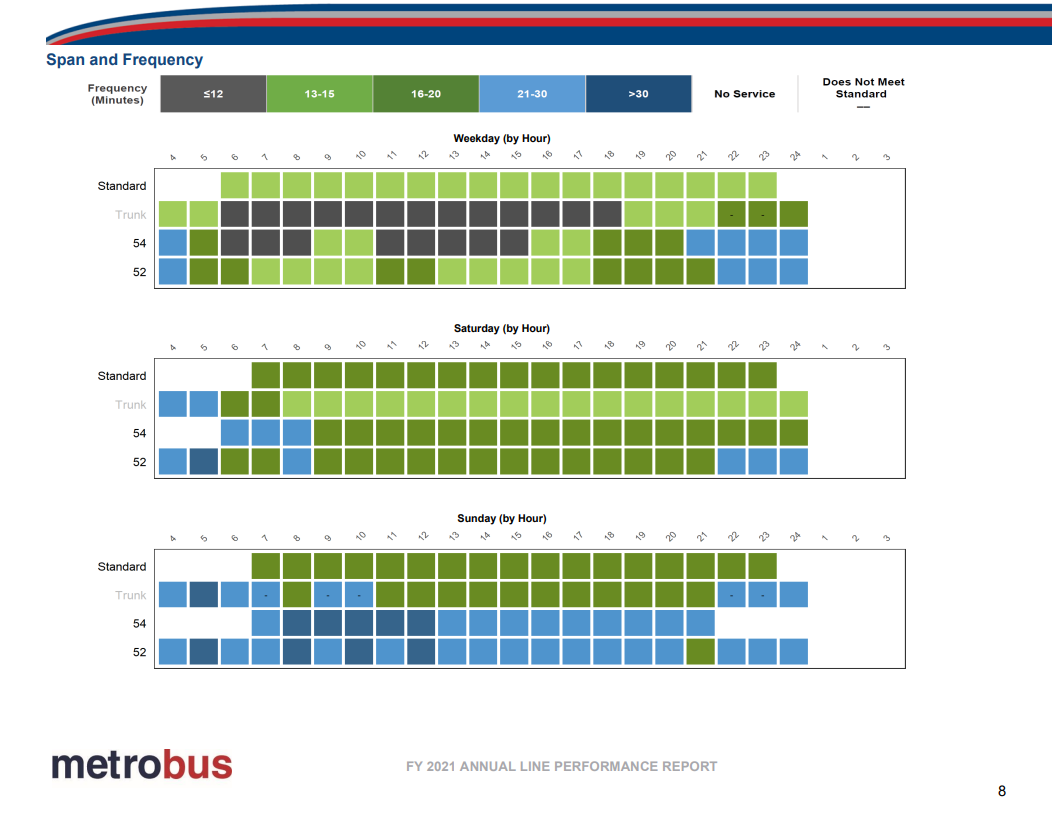
The annual report included assessing each Metrobus line against established performance metrics; various operational, demographic, and travel analyses (including a route circuity analysis); and creating both an annual line performance grade and line benefit score focused on ridership, populations served and the value of the line to the network. These grading systems were visualized via “report cards” to help distill complex information into an easy-to-understand grade. This created a more accessible path to understanding route-level performance as it relates to the overall agency’s goals and will help staff understand which routes to prioritize for interventions, and how, where, and when those routes are failing to meet agency targets.
We used various data sources to compile the report, including several tables from the Trace Model, Ridecheck Plus, and GTFS. The report was created in a way to allow Metrobus staff to replicate it on an annual basis.
Solutions and Outcomes
- Foursquare ITP developed a second iteration of the annual Metrobus line performance report using a fully automated process in the R programming language.