Bigger data sets demand bolder solutions, and that’s why we’re excited to announce the launch of Foursquare ITP’s Transportation Data Science Team. Foursquare ITP has already been pushing the envelope in complex data analysis, web app development, and interactive data visualization for the past several years. With this newly formed team, we’re looking to grow these efforts on a much greater scale.
In the transportation planning sector, technology has vastly changed the quantity of data available to us, and this data demands ever-improving methods to make use of it. Our clients are increasingly turning to us with a growing list of difficult questions about their data, such as:
- How can we better visualize the performance of our services?
- Can you build dashboards and tools to check the quality of our transit schedule data?
- How can second-by-second vehicle location data be used to evaluate the effectiveness of transit improvements?
- How can we use aggregated cell phone location data to inform transit service planning?
Foursquare ITP is bringing the tools of data science to bear on these and other challenging transportation planning problems. Our team of transportation planners and data scientists use code to process and clean complicated data sets, visualize results in interactive maps and dashboards, and divine actionable insights from this complex data. Our team members also build tools and web applications for clients and other Foursquare ITP staff, automating and enhancing analyses that are done frequently.
While we have worked in these domains for some time now, this new team and its members will be more resolutely focused on this aspect of our work. We’re proud those on our Transportation Data Science Team will be not only data scientists, but also transportation planners. In this way, the team will keep Foursquare ITP’s keen focus on project implementation and a sensitivity to the needs of communities, stakeholders, and agency operations.
Our recent work for the Maryland Transit Administration (MTA) in Baltimore illustrates many of the new ways in which Foursquare ITP’s Transportation Data Science Team can address an agency’s biggest data challenges.
- Interactive visualization: To visualize the performance of agency services, Foursquare ITP developed a performance monitoring system and database for BaltimoreLink services that draws from automated passenger counter (APC) data, vehicle location application programming interfaces (APIs), mobile app data, origin-destination data, and more. A suite of Tableau dashboards provides agency staff with an array of insights into this rich data and have replaced static documents.
- Tools and web applications: To identify unintended changes in the agency’s general transit feed specification (GTFS), Foursquare ITP built a custom R/Shiny-based web application that allows agency staff to upload any GTFS feed and see validation results, comparisons to previous GTFS feeds, and interactive visualizations.
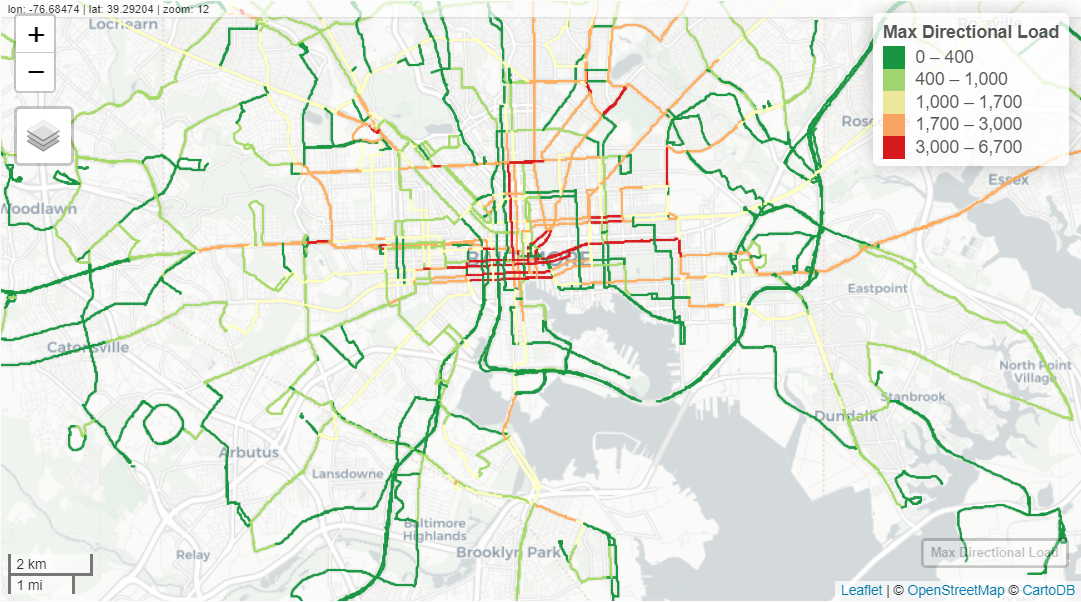
- Complex data analysis: To understand the corridors with the highest passenger loads across multiple routes, our team APC data to the street segment level. To do so, we combined tools from Foursquare ITP’s GTFS to Existing Conditions package written in the R programming language with Open Street Map data. The results were documented in a code notebook with interactive maps to help refine and review the methods with agency staff who did not code.
We invite you to learn more about our Transportation Data Science Team and take a look at several of the tools we’ve already developed. Please reach out to Transportation Data Science Team Manager Adam Recchia and Senior Transportation Planner / Data Scientist Wylie Timmerman to talk more about your biggest data challenges.