In March of this year we launched our new Transportation Data Science Team to grow our efforts in complex transit data analysis, web app development, and interactive data visualization on a greater scale. This work has only become more important in the months since, as COVID-19 has forced agencies to make difficult decisions regarding their service using the data that they collect.
This new team is being led by two of our veteran transportation planners, Adam Recchia and Wylie Timmerman. As our Transportation Data Science Team Manager, Adam oversees the team’s strategic growth and development and business development activities. Wylie, the team’s technical lead, oversees development of new tools, a data science training program for staff, and data science tasks on projects. Josh Diamond, our VP of Innovation, is also providing senior management oversight of the team.
At this time, our team has grown to include four Transportation Planner / Data Scientists: Rebecca Martin, Jack McDowell, Thomas Orgren, and Rebecca Slocum. Whether recently hired or having contributed for a much longer time period, our Transportation Planner / Data Scientists develop new tools for public, agency, and internal use and also perform heavy lifting in R or Python on data-intensive projects.
Along with other members of the Foursquare ITP team who code, these members of the Transportation Data Science Team continue to push the frontier of what can happen when coding meets planning. Since it was founded earlier this year, our Transportation Data Science Team has taken on several new efforts, including:
- Thomas Orgren and Wylie Timmerman worked diligently to develop a Trip Chain Validation tool that validates transit on-board survey responses on trip origins, destinations, and routes used, identifying survey responses that claim to use a transit route that is not feasible on the transit network. Developed in R, this tool uses Open Trip Planner and exports a map and a validation finding for each survey response.
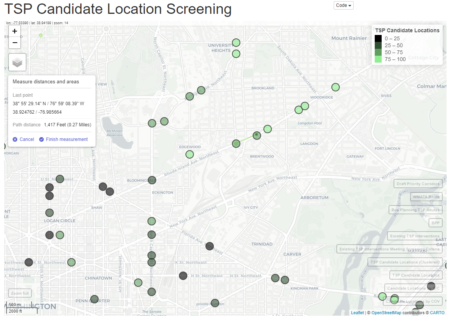
- Wylie Timmerman and Jack McDowell released the initial version of our GTFS to Existing Conditions R package, which consumes any GTFS feed and produces a variety of outputs essential for evaluating current services and planning new ones.
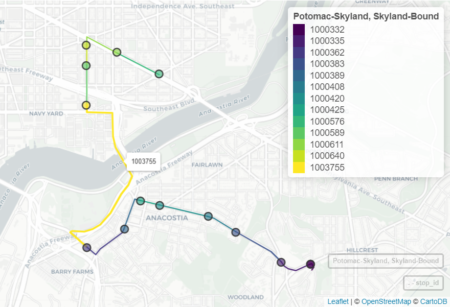
- Adam Recchia and Rebecca Slocum dove deep into AVL and APC data for the WMATA Transit Signal Priority Evaluation project, using WMATA’s Trace model and other sources to evaluate how person throughput and runtime reliability could be affected by Transit Signal Priority.
- Rebecca Martin revamped components of the WMATA Annual Line Performance Report project in R, developing frequency and span of service visualizations and an activity tier analysis that clustered transit routes by the densities of areas they served.
Our team will continue to develop new, interactive tools and conduct complex analysis for our clients, including tools to create, validate, and compare GTFS feeds so that agencies can be more nimble in responding to service disruptions and making service improvement changes. We will also continue to work on the TCRP G-18 research project, which will create a standard specification for transit ITS data similar to what GTFS has done for transit schedule data. Finally, we will continue to provide data science support on transit planning projects including moveDC and the I-495 American Legion Bridge Transit/TDM Study.
We invite you to learn more about our Transportation Data Science Team and our tools by vising our website or reaching out to Transportation Data Science Team Manager Adam Recchia and Senior Transportation Planner / Data Scientist Wylie Timmerman to talk more about your biggest data challenges.