The Washington Metropolitan Area Transit Authority (WMATA) collects farecard data across its bus and rail network, offering a rich source of insight into who its customers are and how they ride. WMATA wanted to better understand its customers and how different groups would react to fare changes, and needed customer segments built from that farecard data to make sense of the patterns.
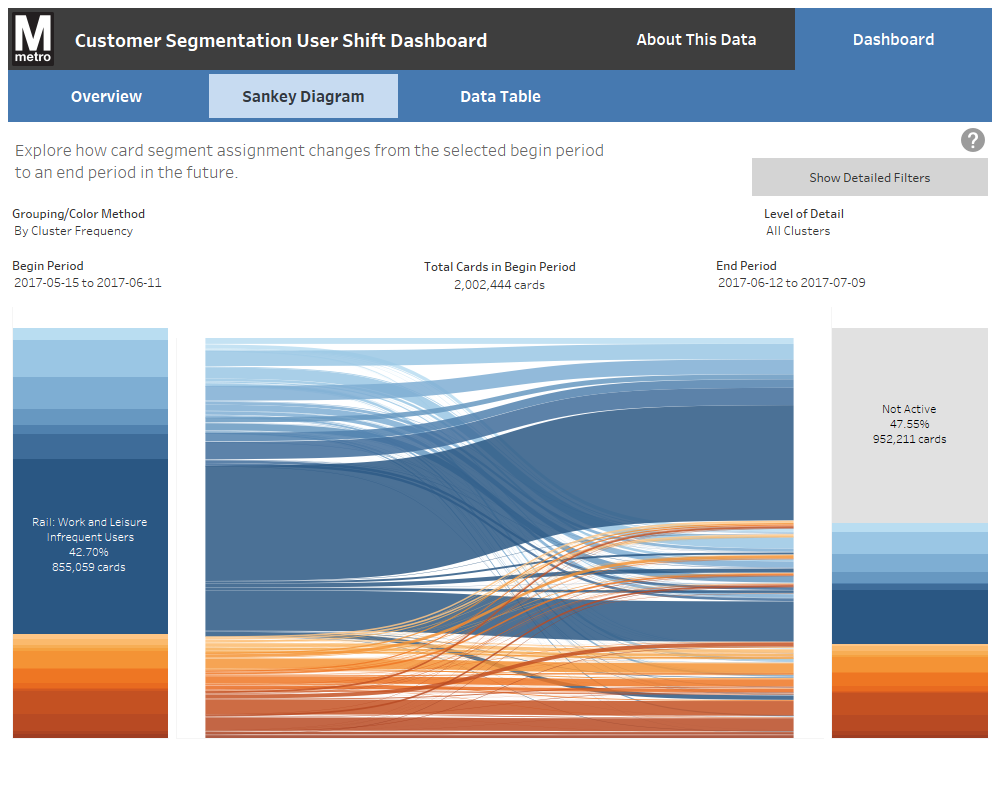
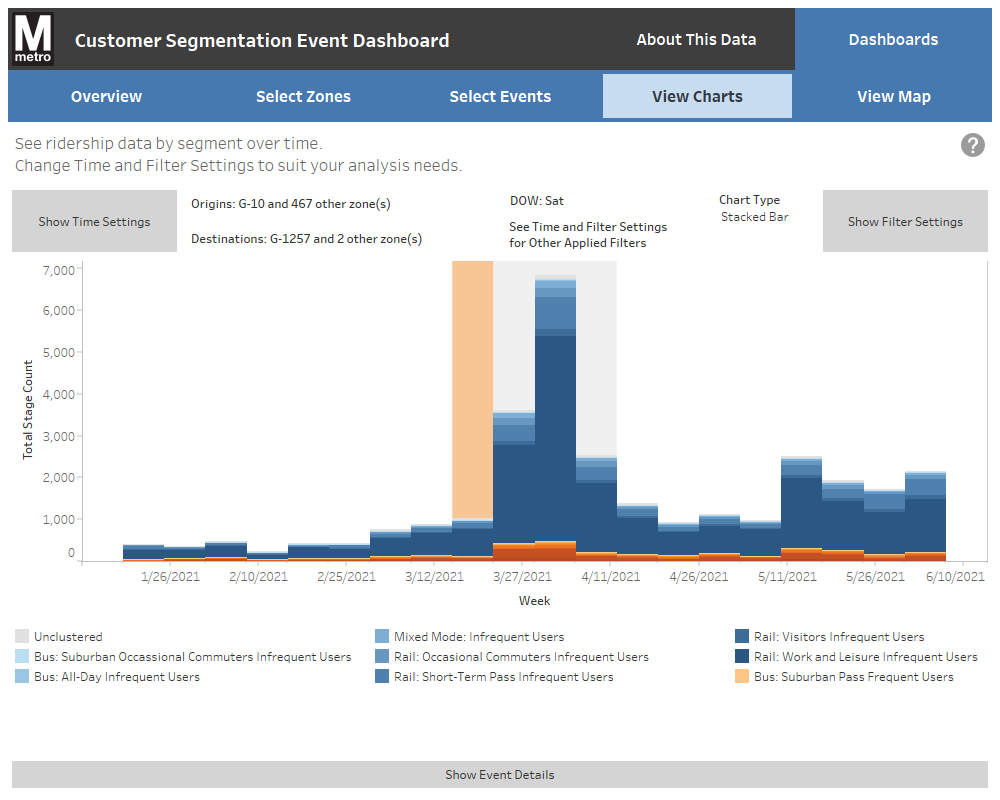
Foursquare ITP organized and analyzed demographic data associated with each customer from multiple sources, including the American Community Survey (ACS), bus and rail surveys, and customer service surveys. The team built a customer segmentation model from that data, ultimately identifying 21 distinct customer segments across bus and rail. Foursquare ITP also led the creation of interactive dashboards to explore the data longitudinally, including segment ridership, churn, and records of external and internal events that could influence ridership.
With these segments, WMATA can measure the impacts of future fare and service changes on each customer type and address differences in fare sensitivity across modes. The project won the People’s Choice award at the Transportation Research Board’s Transit Data Challenge workshop.
Solutions and Outcomes
- Built a customer segmentation model from farecard, survey, and ACS data.
- Identified a final set of 21 customer segments across bus and rail.
- Used segments to analyze fare sensitivity differences across modes.
- Developed a dashboard showing segment ridership and churn over time.