We’re the “People’s Choice”!
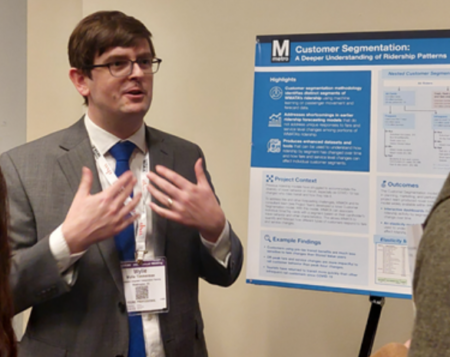
At the 2023 Transportation Research Board Annual Meeting, the Washington Metropolitan Area Transit Authority (WMATA) Customer Segmentation project team won the People’s Choice award at the Transit Data Challenge workshop. I had the honor of presenting this work on behalf of our client, Catherine Vanderwaart at WMATA. In this effort, Foursquare Integrated Transportation Planning (Foursquare ITP) was part of a team that included IBI Group, Korbato, and EBP.
The unique customer segmentation methodology developed for this effort may be what turned heads at the transit data challenge. Our partners at Korbato established a methodology that identified distinct segments of WMATA transit customers by using machine learning algorithms applied to passenger movement and farecard data.
It may help to understand these segments by analogy: in some election seasons, you may have heard of “soccer moms” or “Nascar dads,” terms that roughly group together people who have similar sets of voting behavior. Likewise, the customer segmentation process groups together WMATA customers who have similar sets of travel and fare payment behavior. Using this new dataset as a foundation, our collaborators at EBP also developed a new ridership forecasting model that can more accurately reflect the responses to fare and service level changes that each of the customer segments would have.
What the Tool Can Teach Us
Even for an impressive segmentation and forecasting methodology, the judges and attendees at the Transit Data Challenge—and especially our clients at WMATA—looked for tools and visualizations that can bring this data to life. Foursquare ITP’s role in the customer segmentation project was to produce dashboards and tools that illustrate how ridership by segment changes in response to events. These events could be anything from a fare change, to COVID-19, to public events like a hockey game at Capital One Arena, a block away from a Metro stop.
As Foursquare ITP’s data science technical lead, I love using data to understand what’s happening—and what could be better—in public transit systems. So, it’s rewarding to know that WMATA can use this work to better understand how its customers use the WMATA system. That’s really what working with transit data is all about.
We have learned several things from this data and our dashboard tools:
1. Customers using pre-tax transit benefits are much less sensitive to fare changes than stored value users. With data like this, fare equity studies can provide more accurate estimates of who is impacted when fares change.
2. Off-peak fare and service changes are more impactful to rail customer behavior than peak-hour changes. As WMATA restores rail service and looks to future service improvements, findings like these can guide where improvements will be most useful to the customer.
3. Tourists have returned to transit more quickly than other infrequent rail customers since COVID-19. New findings like this show how the customer segmentation methodology has applications not just to planning and performance analysis, but also to the agency’s marketing and advertising and Metro stations.
We’ve only begun to scratch the surface of this new lens on WMATA’s data. In the rest of this post, I’d like to tell you about how we built it and what your agency would need to do something similar.
How We Built It
Previous customer analyses and ridership forecasts have struggled to model the diversity of travel behavior on transit, especially as COVID-19 has changed who rides transit and how they ride it. With the benefit of Korbato’s data platform (often referred to as “ODX” or “Trace” data), WMATA has unparalleled insights on how anonymous card holders make use of the transit network. The agency hired our consultant team to use this data and other sources to develop a model of distinct segments of customers using WMATA Metrobus and Metrorail.
The customer segmentation methodology developed by Korbato went through several iterations before a final set of groups was produced. First, we extracted characteristics of rider behavior from automatically-collected SmarTrip Card data. These characteristics range from how often a card was used in a 28-day period to whether a card had stored value or a pass. More advanced characteristics included a “visitor score” produced for each card; using cards that were first loaded at the Reagan National Airport Metrorail Station, a neural network that could identify “visitor” behavior was defined. The neural network could then be used to find other visitor cards with similar travel behaviors. The use of automatically collected SmarTrip data ensures that this process can be repeated on an ongoing basis for new customers.
Next, we selected, clustered, and evaluated sets of characteristics for use in a customer segmentation model. In addition to developing segments that were statistically distinct, a key consideration was to develop segments that were interpretable. These new segments may not have names as pithy as “soccer moms” or “Nascar dads,” but they are similarly easy to picture in your mind and reason about. In total, we tested 3,614 different segmentations covering 191 different combinations of features.
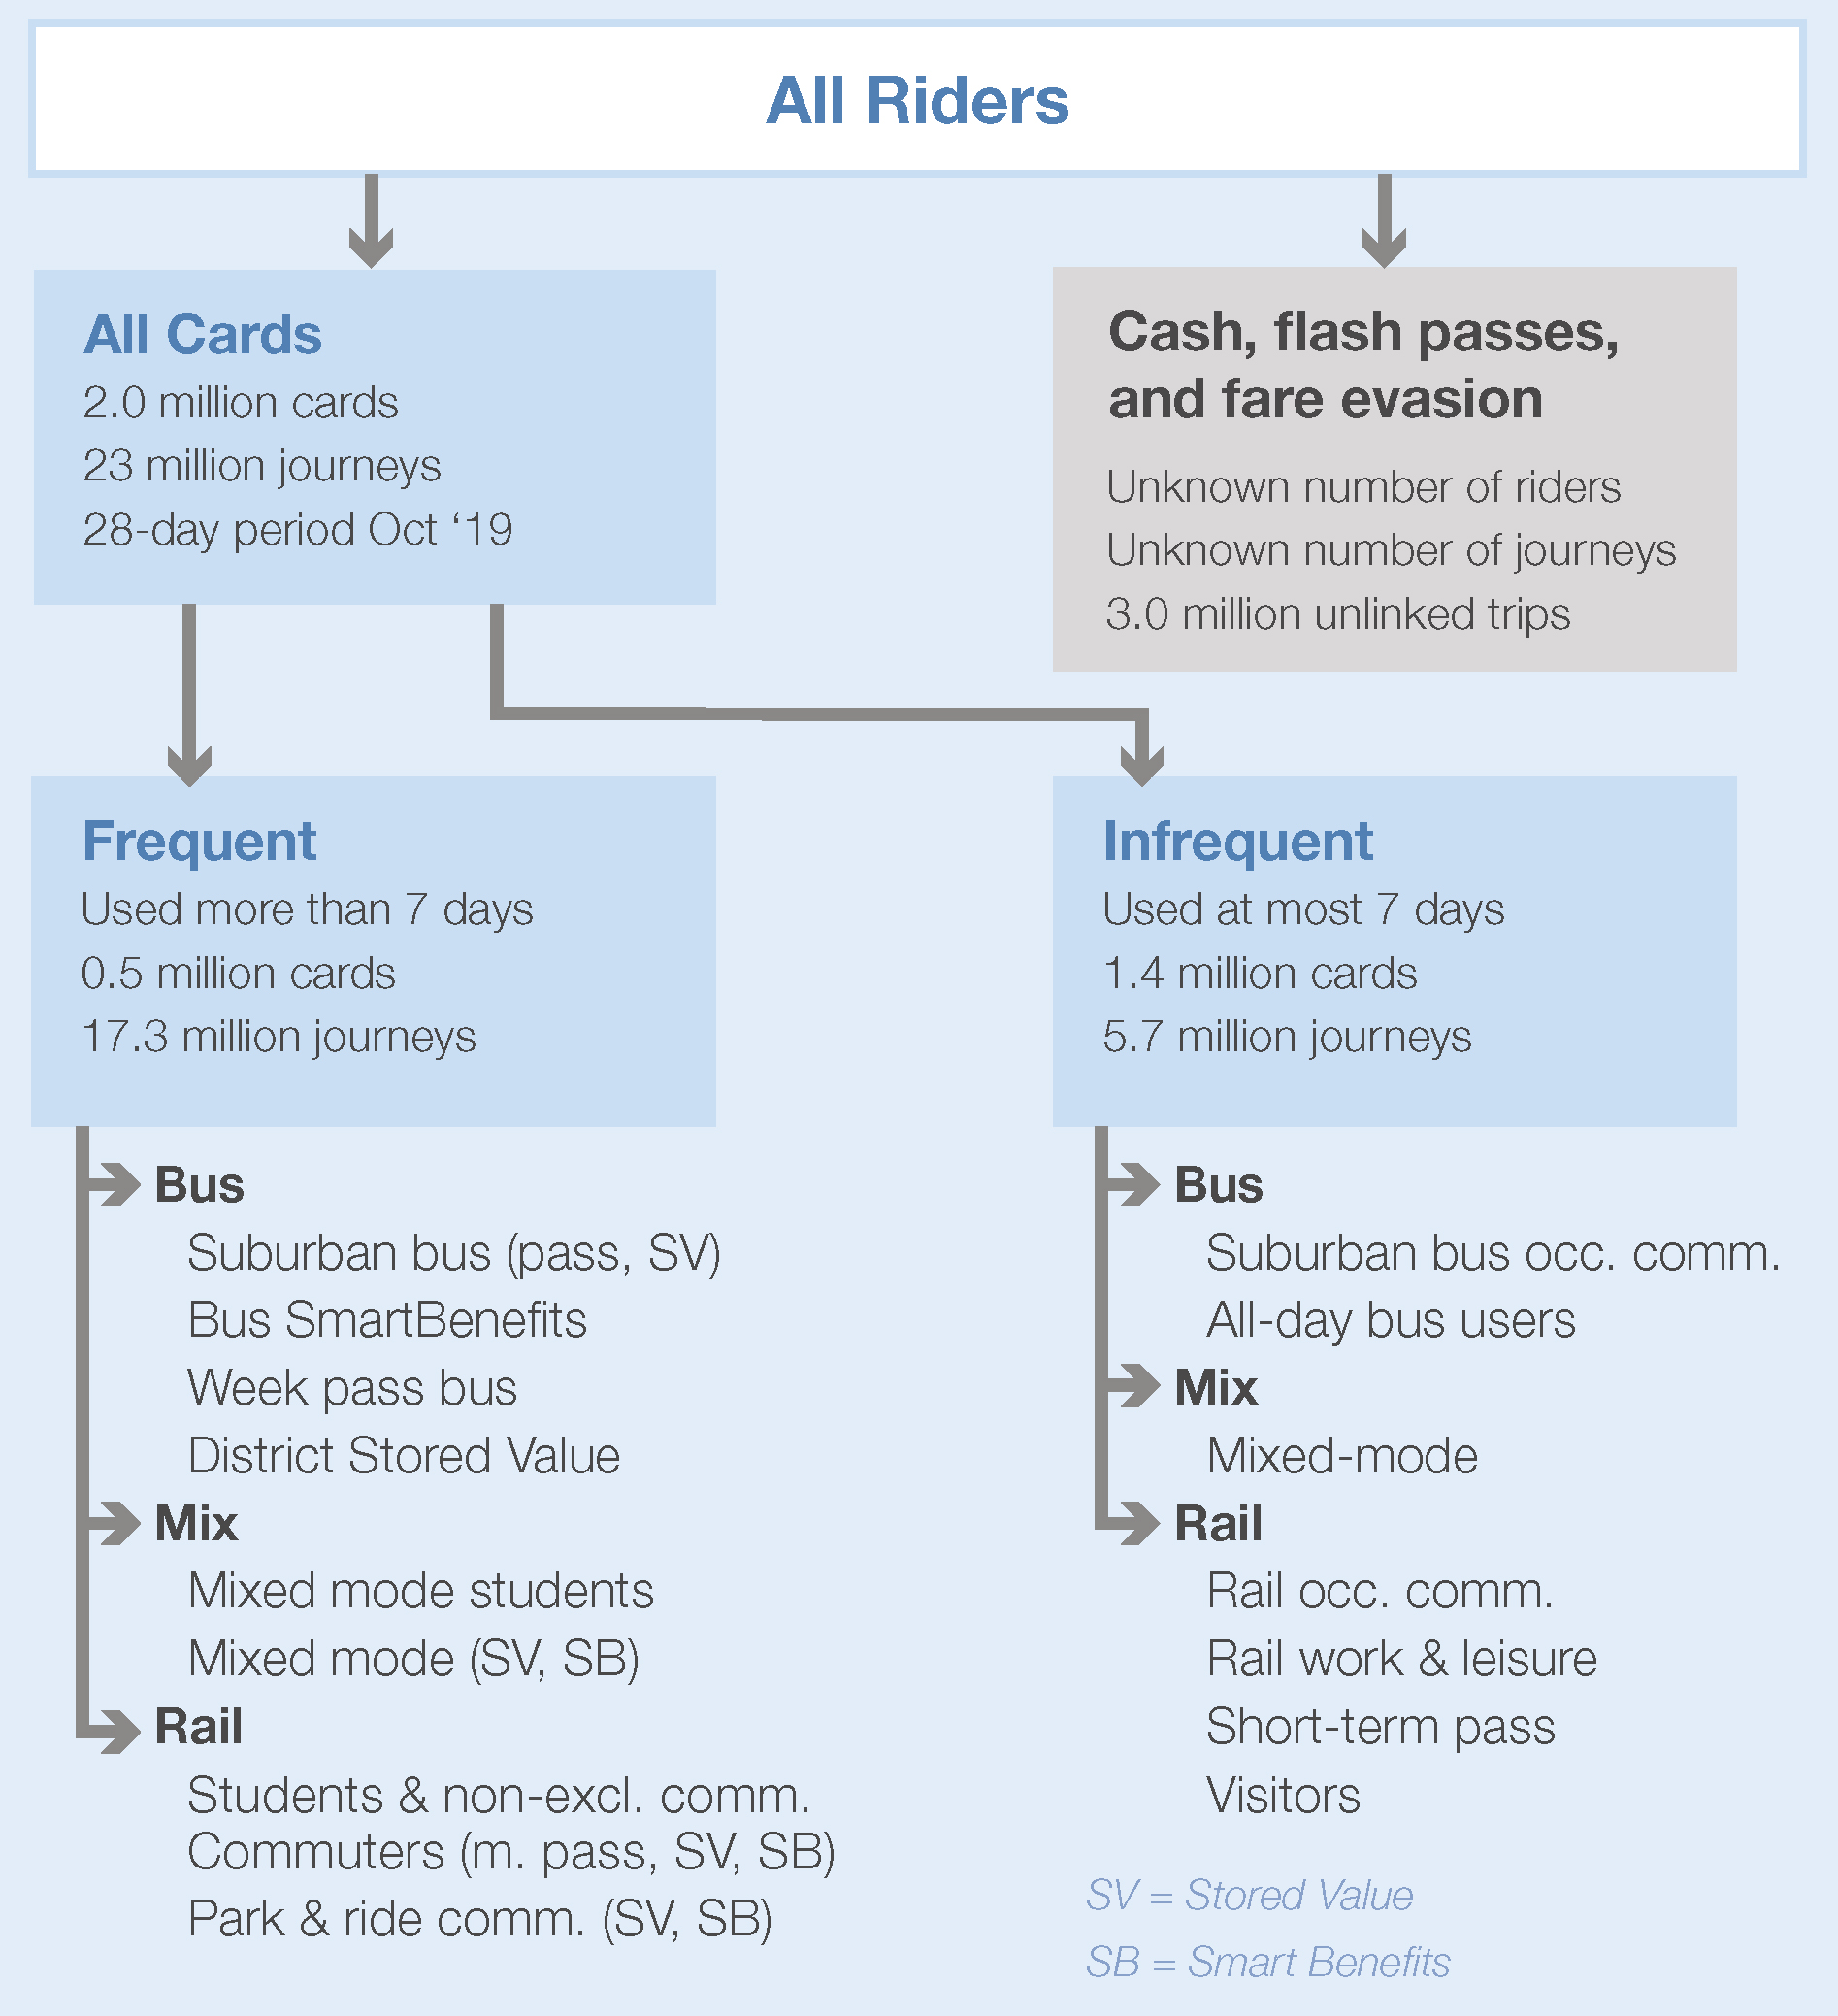
After many iterations, we identified a final list of 21 segments: 14 for “frequent” customers and seven for “infrequent” customers (See Figure 2). When used in a ridership forecasting model, we were pleased to see that these customer segments were able to address challenges like different levels of fare sensitivity across rail and bus modes. For other agencies who want to undertake an effort like this, it’s important to keep your goals in mind throughout the process. At WMATA, for instance, developing a set of customer segments that could be analyzed in a variety of fare and service change analyses was important. In particular, the nested nature of the segments developed here will make the framework easy to adapt to analyses both simple and complex. If your agency is performing a detailed analysis of peak and off-peak travel behavior, decisions in the steps above might be made differently and would likely result in different sets of customer segments.
A Deeper Understanding of Ridership Patterns
Using the customer segmentation data on its own is a formidable task: a few years of data run into hundreds of millions of rows in a database, and if that isn’t enough, analysts using the data need to link these origin-destination flows to a set of bus stop and station clusters in order to filter and visualize the results.
To help WMATA analysts make sense of it all, Foursquare ITP developed a set of dashboard tools that can readily answer key questions like:
- How has the composition of WMATA’s ridership changed over time?
- How do customers in each segment respond to disruptions such as major trackwork, large public events, fare changes, and service changes?
For instance, the customer segmentation events dashboard can be used to identify which clusters have seen the fastest ridership rebound since Washington, DC’s stay-at-home order in March 2020 (a period highlighted in orange and grey within the dashboard using a set of customizable event filters).
In the example shown in Figure 3, the visitor segment rebounded strongly in percentage terms beginning in Q2 2021, especially when compared to the work & leisure segment. The dashboard can be further filtered by origin and destination zone, time period, mode, and day of week. The user shift dashboard helps analysts visualize how passengers can shift between segments in response to service changes, such as fare increases or reduced or increased service. For example, in Figure 3 we can see that cards in use in February 2020 and February 2021, many frequent card users (orange colors) in February 2020 (left-hand column) have become infrequent (blue colors) card users in the subsequent period (right-hand column). This change is a reflection of less frequent journeys to work following the outbreak of COVID-19 in early 2020.
For other agencies working with complex and voluminous data like this, it’s important to approach the user interface thoughtfully. Foursquare ITP split components of the dashboard across multiple views, so that geospatial filters, event selections, charts, and map-based visualizations took place on different pages. We also directly incorporated walkthroughs and background information on the data into the page so that analysts would not need to refer to a separate document to use the data.
What’s Next
With the customer segmentation effort, Foursquare ITP and the project team brought a practice common in the private sector to public transit. WMATA can apply this customer segmentation to a range of planning and policy problems, by:
- Understanding how ridership patterns for specific segments of customers change over time.
- Quantifying how different types of customers respond to fare and service changes.
- Producing more accurate forecasts of ridership and fare revenue.
Analyzing the impacts of potential policy changes on different groups of users whose needs may not be well captured by other decision-making methods.
We’re proud of our effort and the resulting “People’s Choice” award at the Transportation Research Board’s 2023 Transit Data Challenge. If you’d like to learn more about applying segmentation methods to your data and building the data infrastructure to understand it, please reach out to us at marketing@foursquareitp.com.