Happy GIS Day! Here at Foursquare ITP it seems like every day is GIS day, but today we give special recognition to this powerful technology that shapes and reforms our daily work.

But first, what is GIS? GIS, or Geographic Information Systems, is a tool for managing and analyzing spatial data and helps to identify patterns and relationships within spatial and non-spatial data, which helps us make informed decisions. GIS is used to perform spatial analysis, highlight issues driven by geography, make maps to share information, and solve complex problems around the world.
GIS is used by an extremely diverse array of fields, including Public Health, Water, Retail, Telecommunications, and many more. In fact, you even use GIS on a daily basis. Here is a quick test: Do you use Google Maps? Have you ever taken an Uber or Lyft? Ever used a mobile banking app? Well, those services all rely heavily on GIS, and would not look like they do today without it. GIS shapes our daily lives in ways that we don’t even realize, so today we take some time to recognize how it has, and will continue to, shape our world.
My name is Jennifer and I have been a transportation planner at Foursquare ITP for two years. My experience with GIS began seven years ago during a summer internship where I became fascinated by the software and its capabilities. Since then, every job I have had has been GIS-focused, giving me the chance to learn about many different aspects and subareas within the GIS industry.
Today, I serve as the GIS administrator at Foursquare ITP where I manage our licenses, organize company-wide GIS trainings, and share my enthusiasm for GIS with my other GIS-loving coworkers! Here at Foursquare ITP, GIS serves as the basis for nearly all the work we do.
GIS at Foursquare ITP
Our GIS work is done mostly inside of ESRI’s suite of products including ArcGIS, ArcGIS Pro, and ArcGIS Online. However, we also use open data formats such as QGIS, Open Trip Planner, and R. Our use of GIS often includes analyzing existing and projected demographic and employment patterns to support transit planning, creating routable networks to assess pedestrian and bicycle access, building geographic databases to manage complex data inventories, and evaluating performance of existing and proposed transit service.

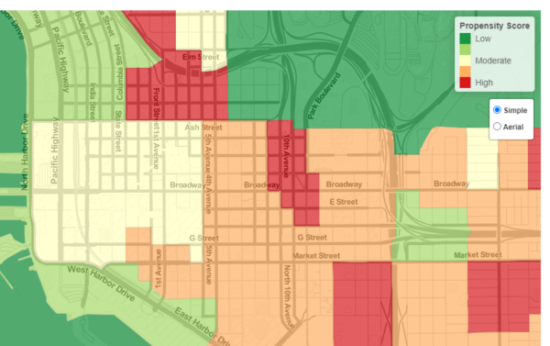
One of our common uses of GIS is to combine and overlay a variety of data sources to conduct propensity analyses. For this, we are using a broad array data including census, jobs, and land use data, overlaid with existing transit data to help us identify where the highest need for transit use exists. Such an analysis would be nearly impossible outside of a spatial environment and is crucial for informing any recommended changes to transit service that we make. GIS allows us to quickly and easily overlay these data sources and extract information about existing conditions in any given location, such as within a census block, a study corridor, or a town.
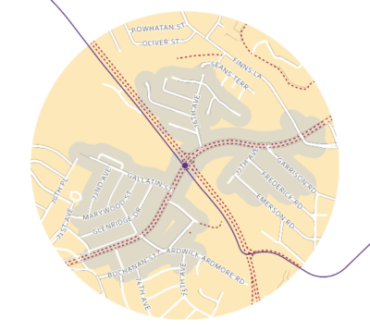
Since we work in the field of transportation, we also conduct network analysis in GIS, which allows us to incorporate roadway, bicycle, and pedestrian networks into our planning. What this means is that we can, for example, measure how far a person could walk, bike, or drive from any given location within a specified distance or time. Once we run the network analysis, we can use the results to determine how many people or jobs are within the network. For example, we can conduct a network analysis to answer a question such as: How many Washington, D.C. residents can access a grocery store by bus? Answering this question allows us to make recommendations and test scenarios for improving roadway networks to increase access to destinations such as transit stations, public services, and schools. Currently, we are building a pedestrian network to assess walk access to rail stations in Maryland!
Foursquare ITP Innovations in GIS: ArcPro
Last year, as a company, we transitioned from ArcMap to ArcPro. This included a series of internal trainings where together we learned the nuances and new capabilities of the platform. Although ArcPro is technically the same program as ArcMap, its interface is dramatically different which results in a somewhat steep learning curve for those who have been using ArcMap for many years.
Today, just eight months since our transition kickoff, we have implemented ArcPro on a majority of our projects and workflows. Our staff has been overwhelmingly satisfied with not just the improved interface and reliability of ArcPro, but also its project-based design, better online integration, and advanced data visualization capabilities.
Foursquare ITP Innovations in GIS: ArcGIS Online
We have also spent the last year expanding our use of ArcGIS Online (AGOL) by integrating its capabilities into over fifteen projects. AGOL provides us a flexible and intuitive workspace to share and review data, both within and outside our organization, as well as quickly and easily visualize data in interactive formats.
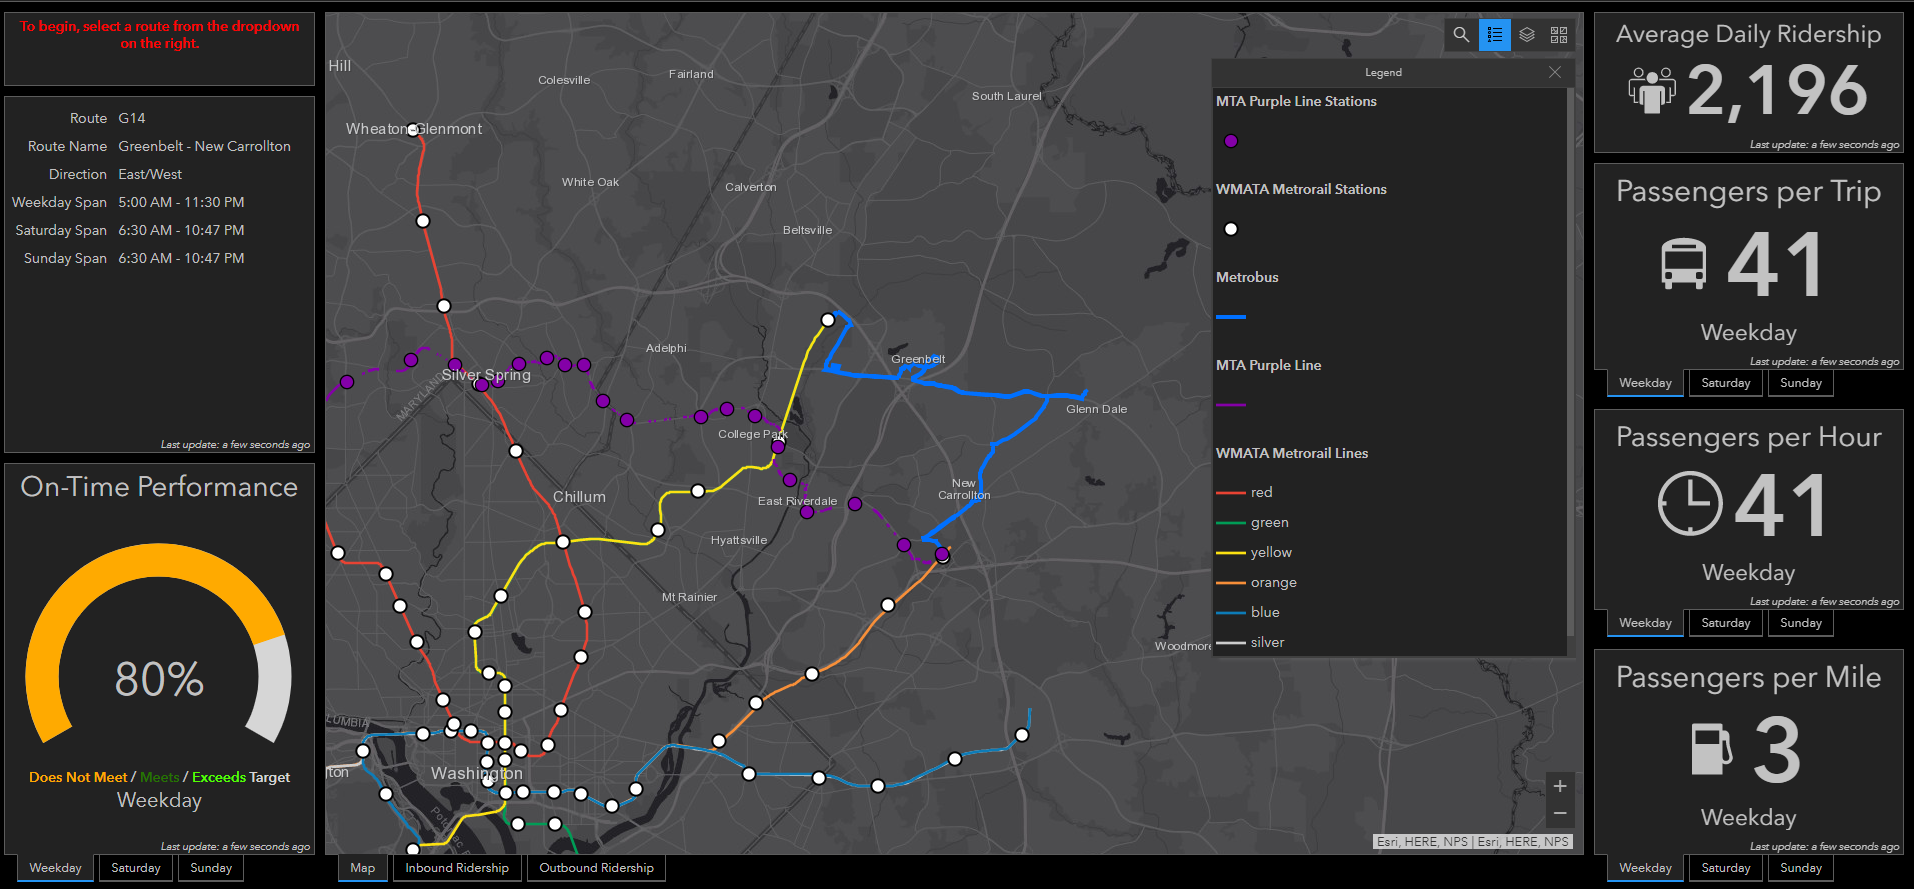
For example, to support and streamline our internal planning processes, we developed an online dashboard detailing performance metrics of study area bus routes in a dynamic fashion. This eliminated the need to search through numerous GIS files, performance reports, and spreadsheets during service planning. Rather, all necessary information to inform our decisions was available at our fingertips.
We have also utilized AGOL to offer solutions to data management challenges. This year, we developed an online interface to allow the Maryland Department of Transportation Maryland Transit Administration (MDOT MTA) to maintain, analyze, and share bus-stop data. This included hundreds of data fields for the nearly 4,000 bus stops in their system! The AGOL solution integrates several components including ArcPro, Web AppBuilder, ArcGIS Dashboards, and Survey123.
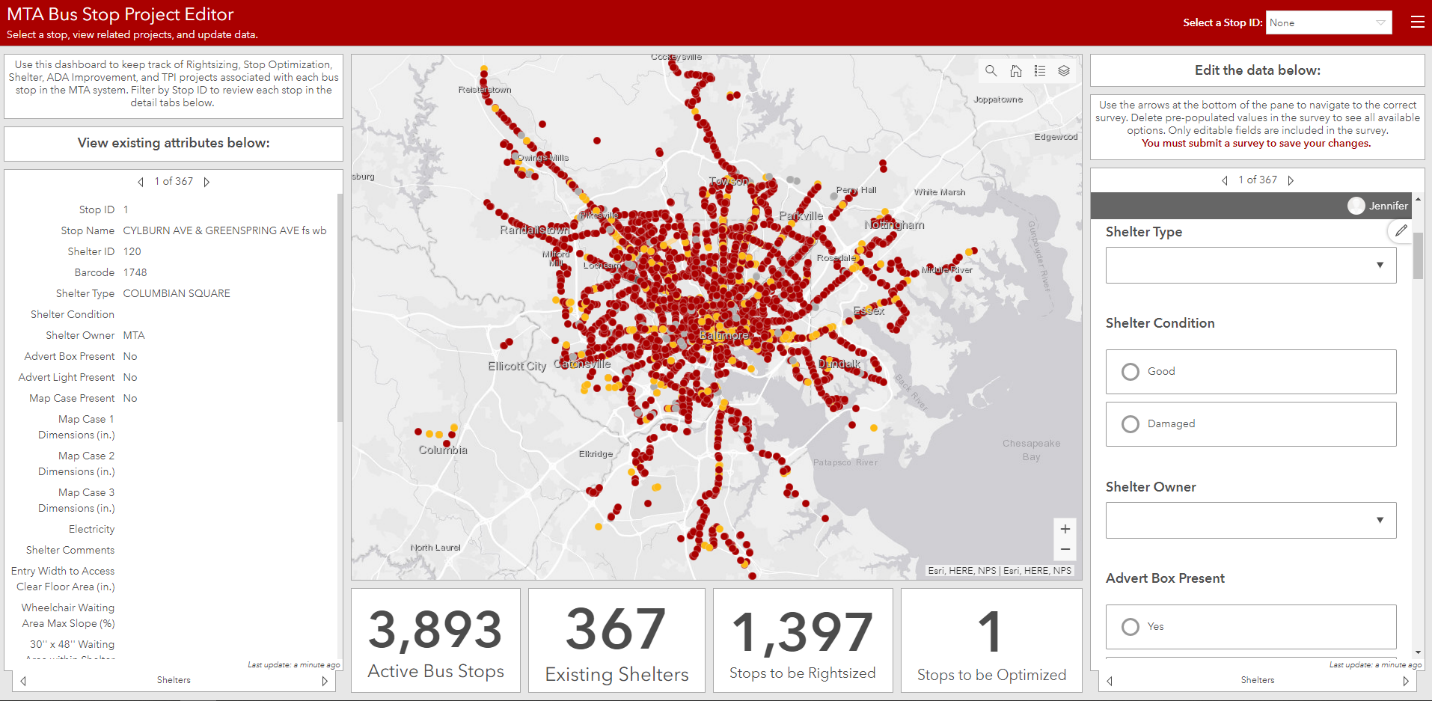
Using a relational database hosted online and custom survey forms to ensure uniform data input, project stakeholders are able to update and maintain data in real time, all in one location. A corresponding “viewer” web application was also developed which allows non-editing project members to view, filter, analyze, and download the same data without the need for tedious data requests. We are very pleased that we were able to combine several out-of-the-box solutions to solve a complex data problem!
Happy GIS-ing!
I hope that by sharing some of the exciting ways we use GIS, you were able to better understand and celebrate the power of GIS and spatial analysis in helping individuals, organizations, cities, and states to make informed and data-driven decisions! Happy GIS Day!