We’ve taken a major leap forward in helping agencies understand where and why people are most likely to use transit.
Our Transit Propensity Model, a tool for identifying transit-supportive geographies, now incorporates machine learning algorithms to more precisely pinpoint the demographic and employment factors that drive transit use in a given area. The result? Sharper, data-driven insights that help agencies design better service, faster.
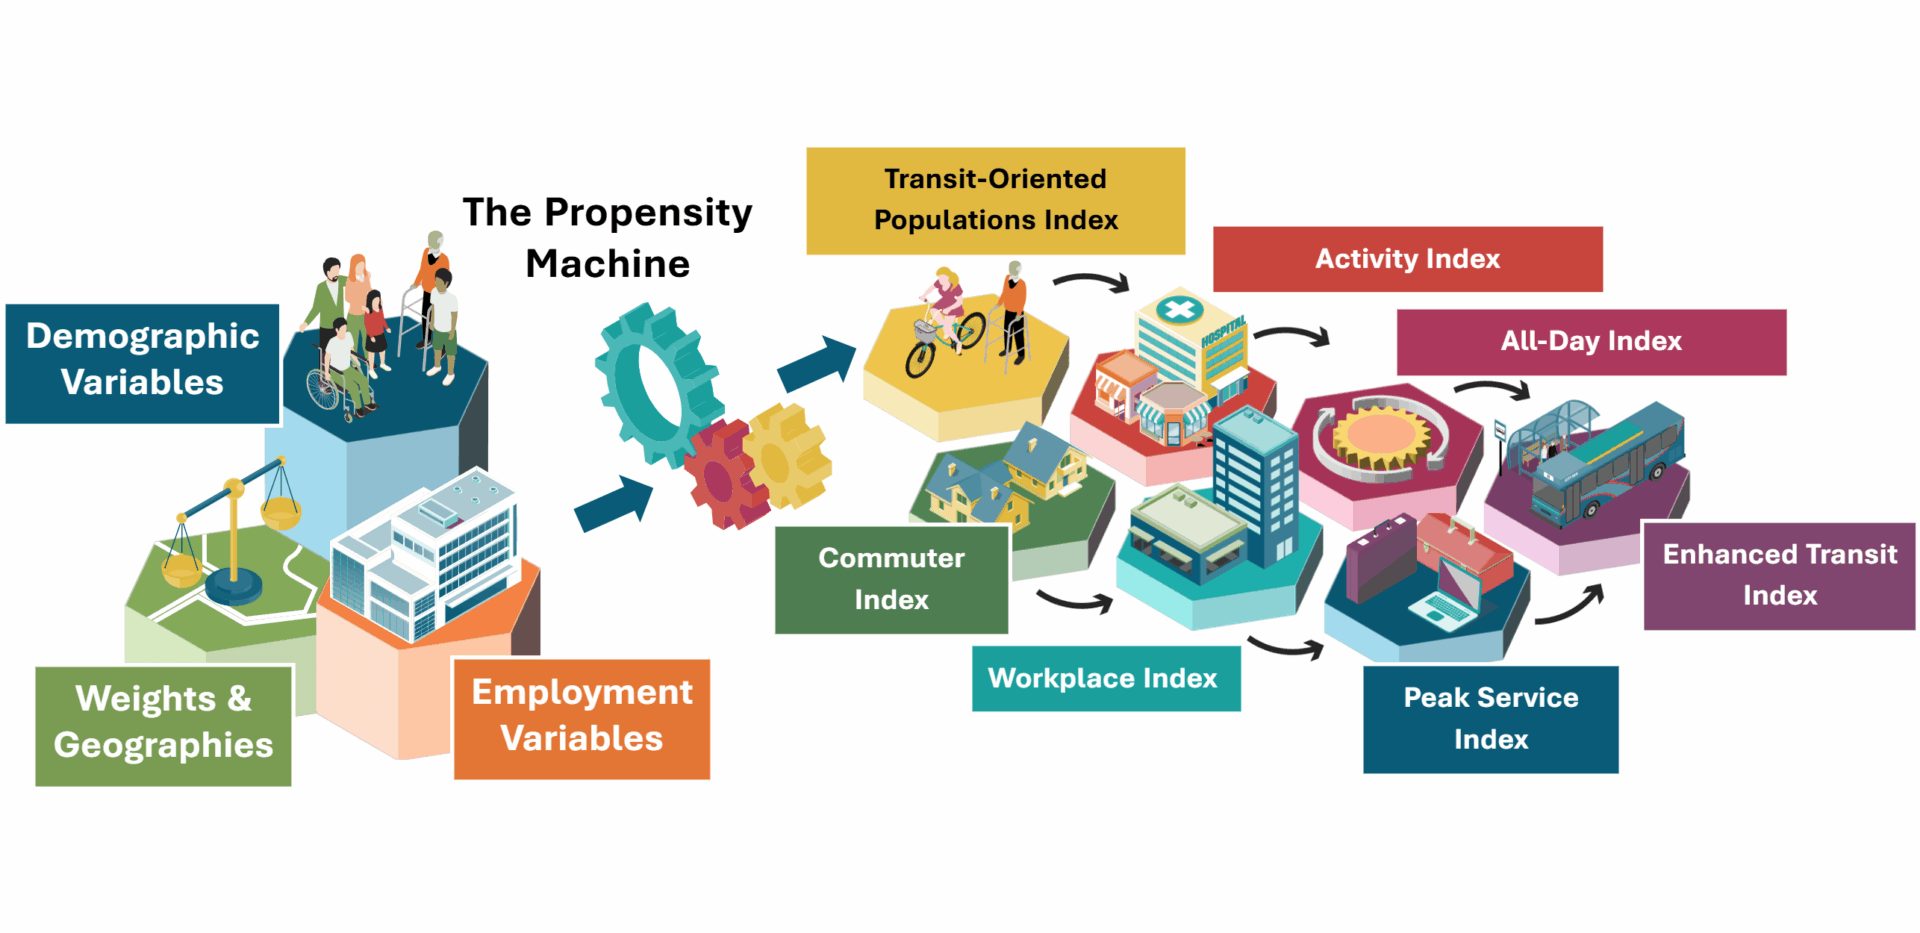
Built by Foursquare ITP, the model generates detailed indices for:
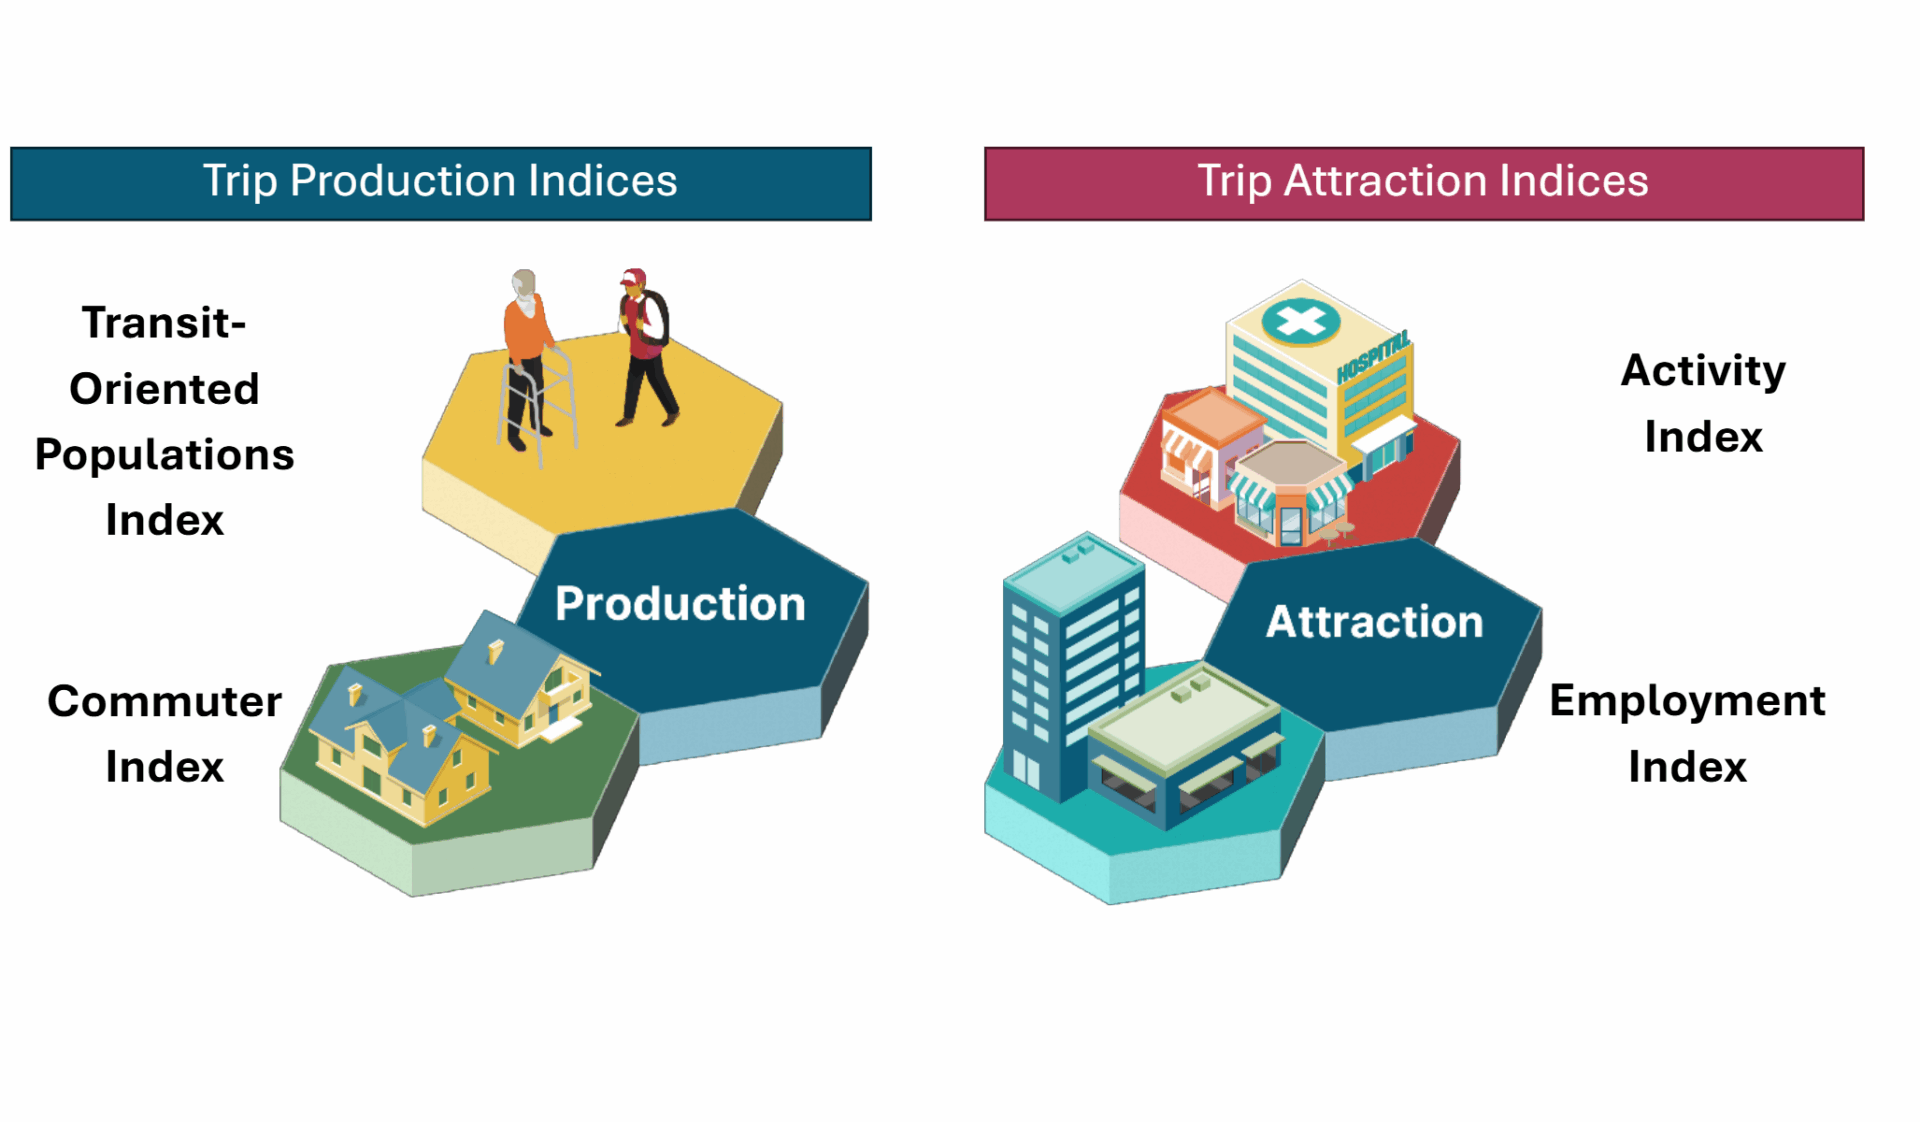
- Transit-oriented populations.
- Commuters.
- Employment centers.
- Activity locations.
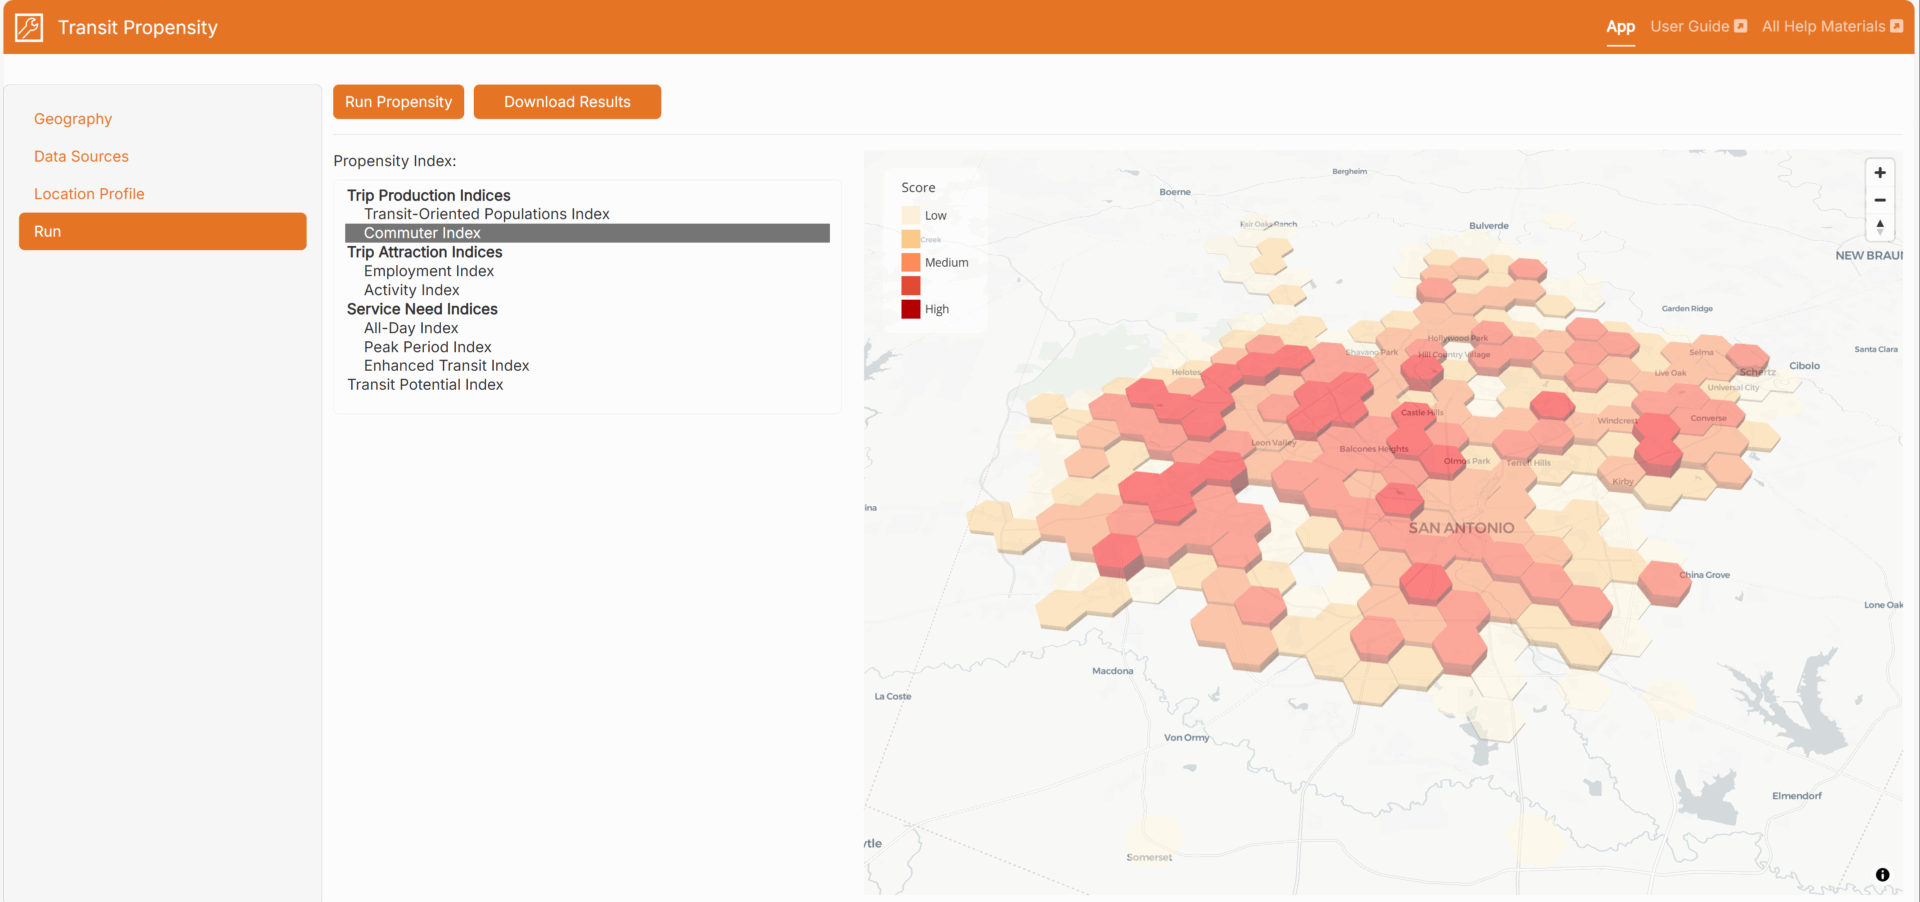
These indices are then synthesized into actionable layers, such as the all-day index, peak service index, and enhanced transit index, to make it easier to match service type and frequency to area needs.
If you’re planning a network redesign, analyzing existing conditions, identifying corridors for high-frequency service, or simply interested in understanding the likelihood of transit use in your area, our updated model helps you do it with greater confidence and clarity. Our integrated model is powered by Census data, labor data, and real-world ridership, enhanced with machine learning and advanced statistics, and designed for smarter transit planning.
Want to learn more or see it in action? Visit our website or reach out to our data science team: